- > Home
- > About
- > Math as Art
As the study of natural and abstract patterns, mathematics is an inherently creative and artistic pursuit.
Unfortunately, many students have been mistaught that math is dry, rote, and one-dimensional, devoid of creativity and inventiveness, and lacking any connection to the arts.
Advances in computing technology have finally made possible the widespread discovery and appreciation of the sublime beauty of mathematics.
The art of math can now be enjoyed by all!
I hope you'll like the following graphs of mathematical relations I created involving nothing more sophisticated than high school precalculus.
Designed in 2018 using the Google Search graphing calculator:
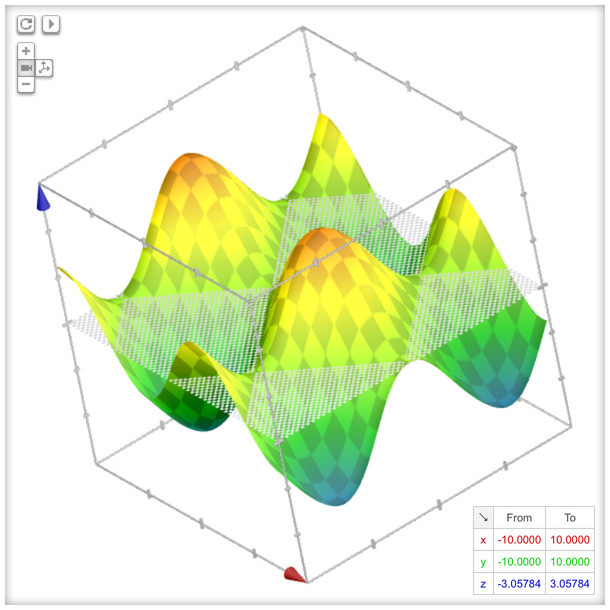
Egg Carton
z = sin(x/2)+cos(y/2)
Wrinkled Paper
z = x-y+tan(x)-cos(8x-sin(2y))
Fancy Lapels
z = arcsec(sin(1/x)-cos(1/y))
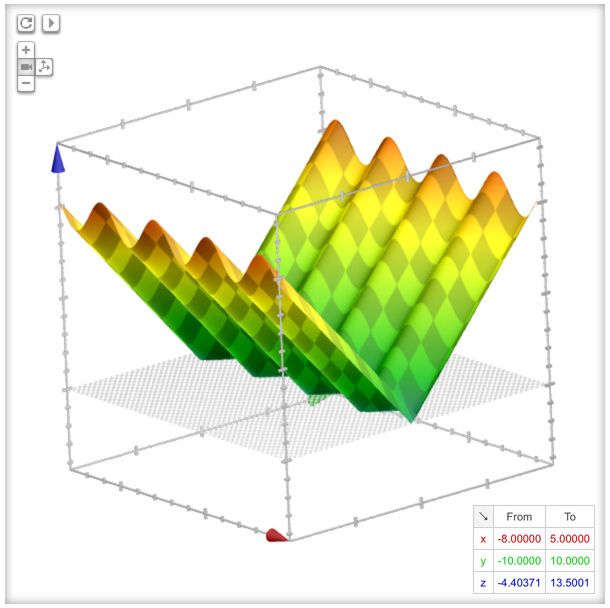
Corrugated V-Roof
z = abs(sin(2x)-y)
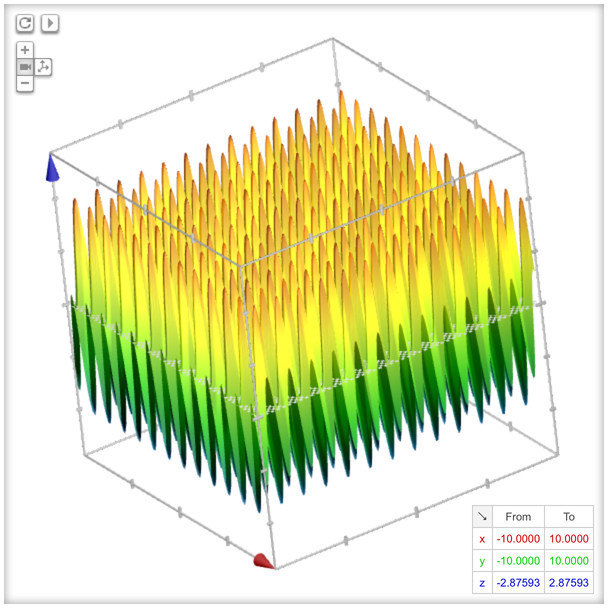
Bed o' Nails
z = sin(4y)+cos(4x)
Arizona Desert
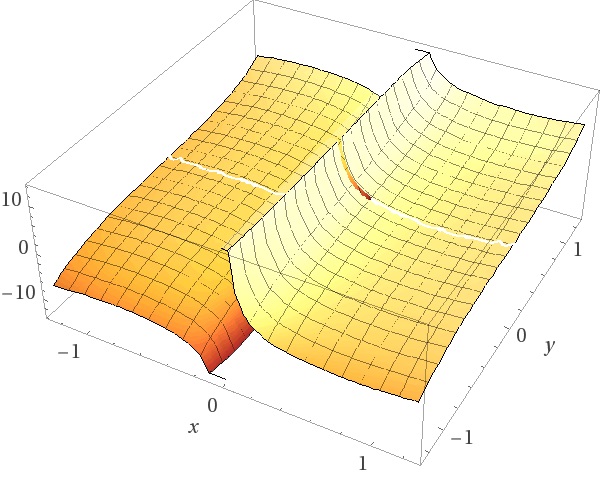
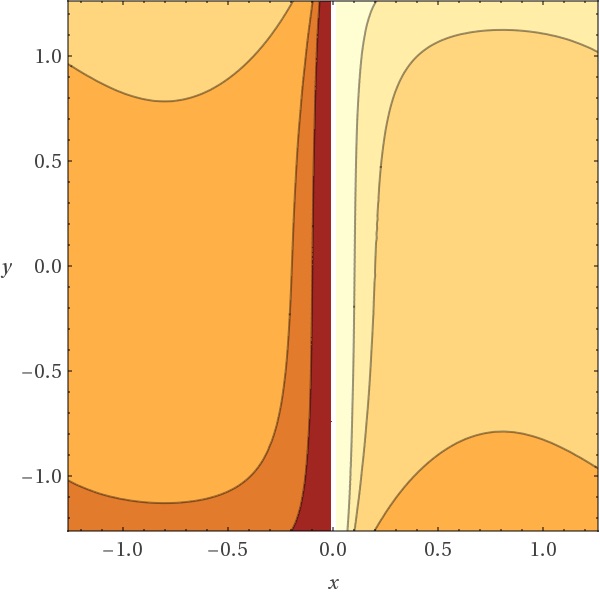
z = (x-y)/(sin(x)+1/cos(y))
Celery Row
z = (sin(x)cos(y))/(x-y)
Three Fingers
z = log(sin(1.1x)-y)
Plastic Chair
z = -abs(x)+2x^4-abs(x^2*y^3)
Lettuce Garden
z = 1/(sin(x)-cos(y))
Designed in 2018 using Wolfram Alpha:
Mesa Group with Hills and Valleys
z = sin(2x)cos(2y)exp(-(x^2+y^2)/6)
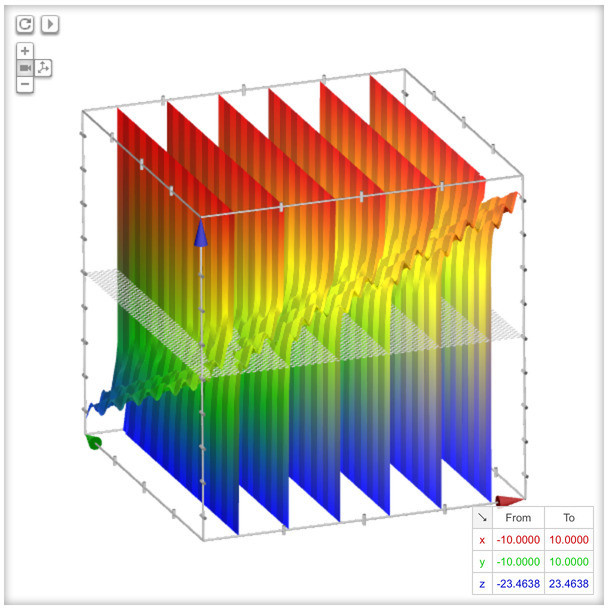
Slanting Waves
z = xsin(y)
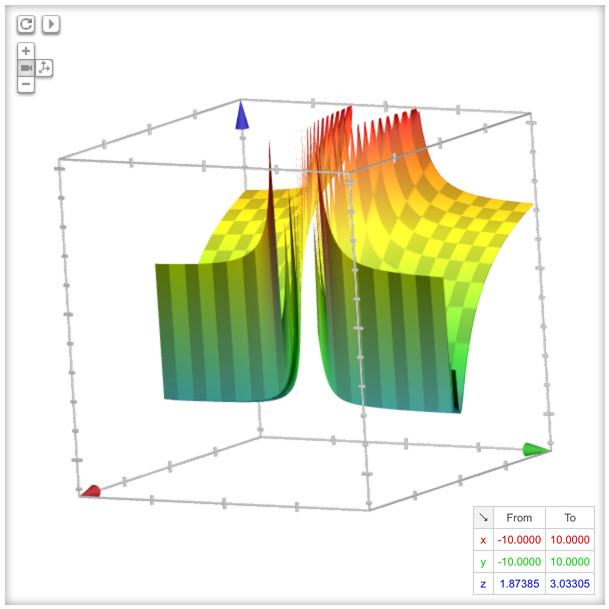
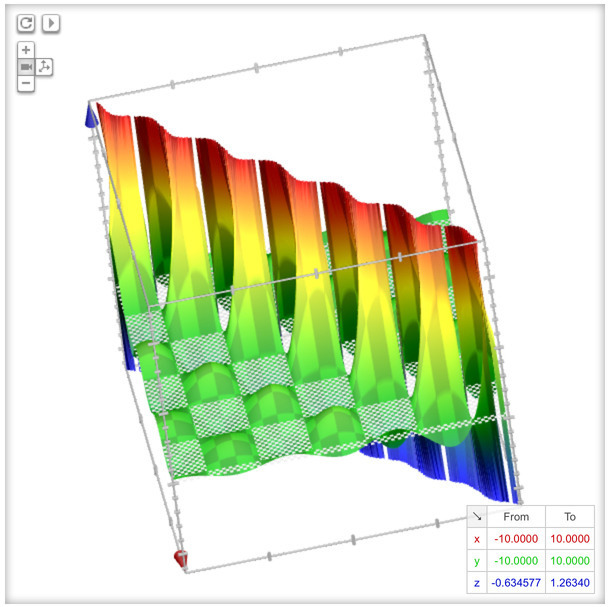
Tartan Forest
z = tan(.01sin(x)cos(y))^2
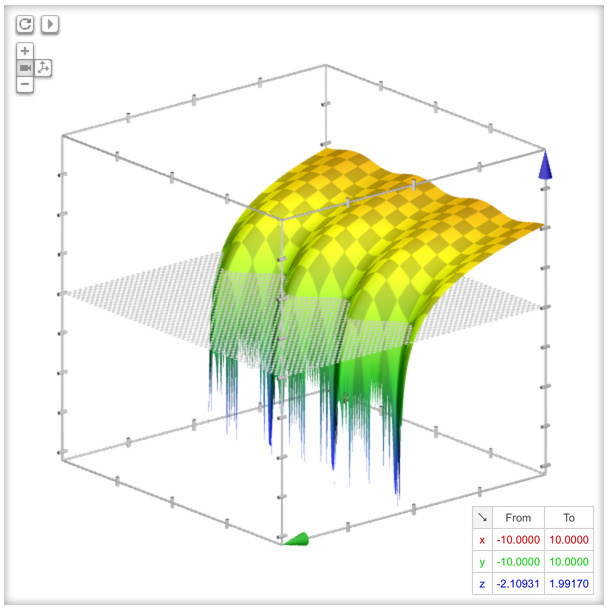
Techtonic Rift
z = x^3+tan(y)+cot(x)+y^3
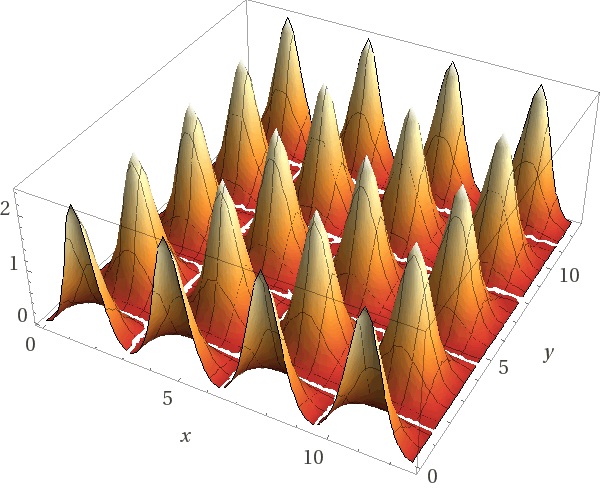
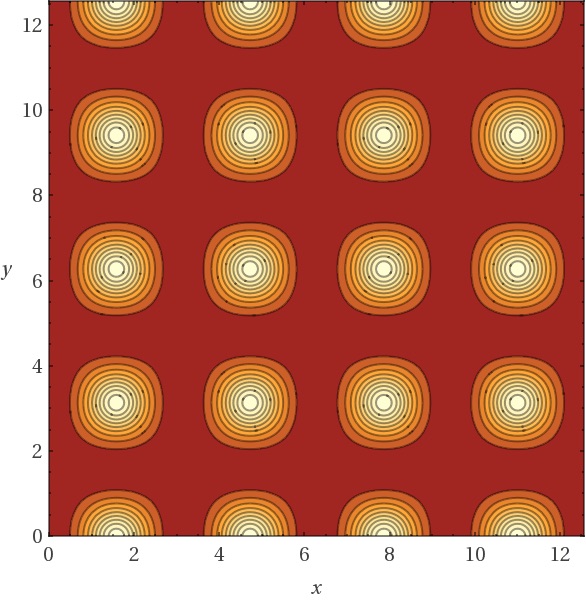
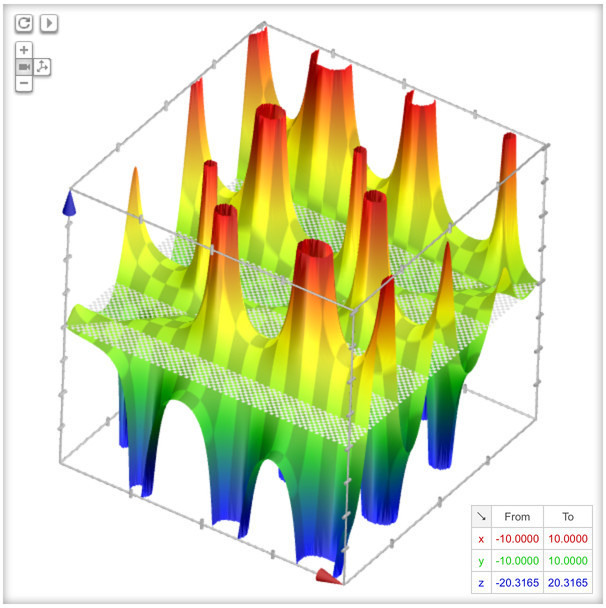
Spikes
z = tan(sin(x)cos(y))^2
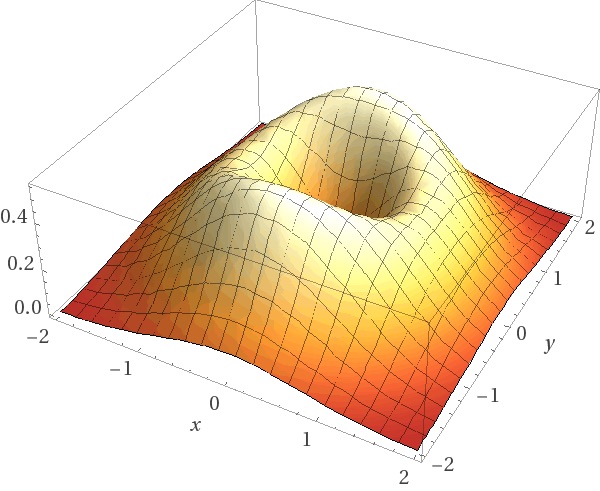
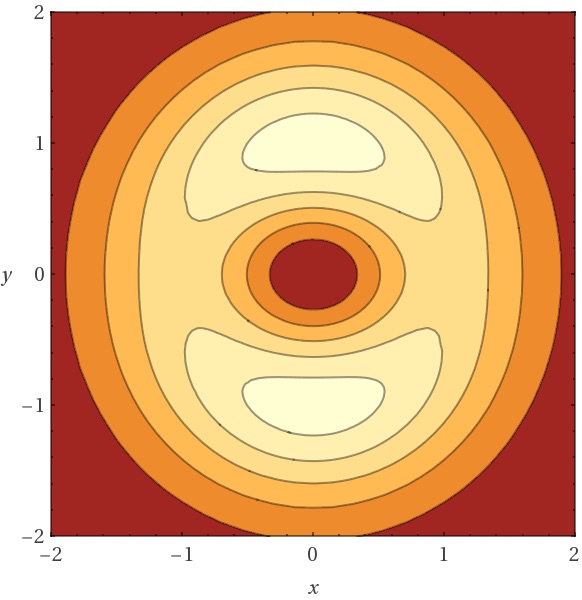
Gaping Maw
z = (x^2+1.5y^2)*e^(-x^2-y^2)
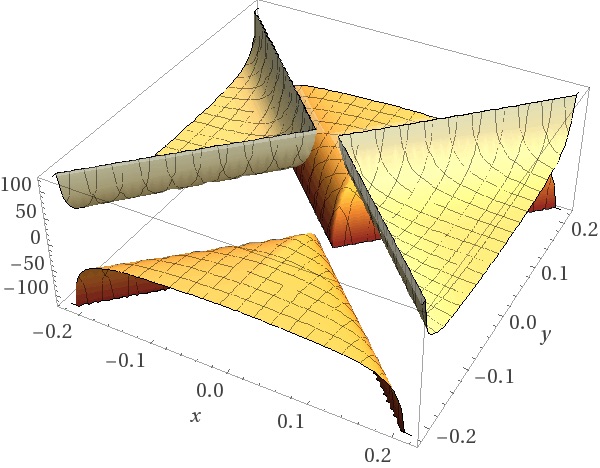
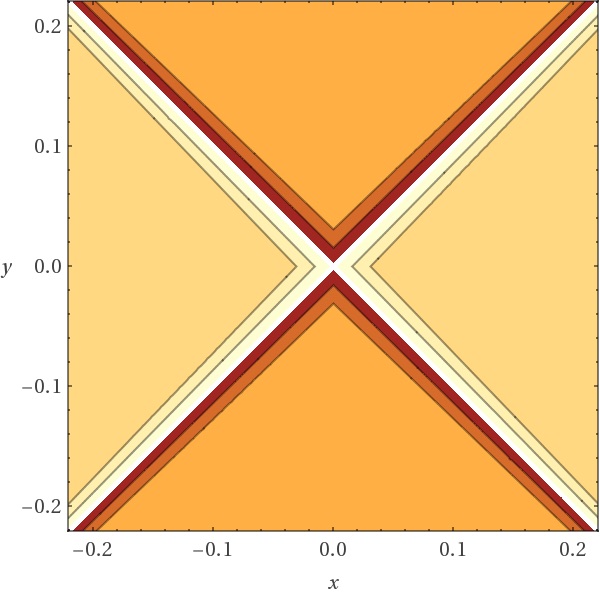
X Marks the Spot
z = (arccos(abs(x)+abs(y))/arcsin(abs(x)-abs(y))
Wavy Incline
z = -cos(xy)+y
Dimpled Vase
z^2 = x^6-x^2+y^6+y^2
Squarish Tube
x^2-y^3+z^4 = 1
Designed in 2018 using Apple's Grapher app:
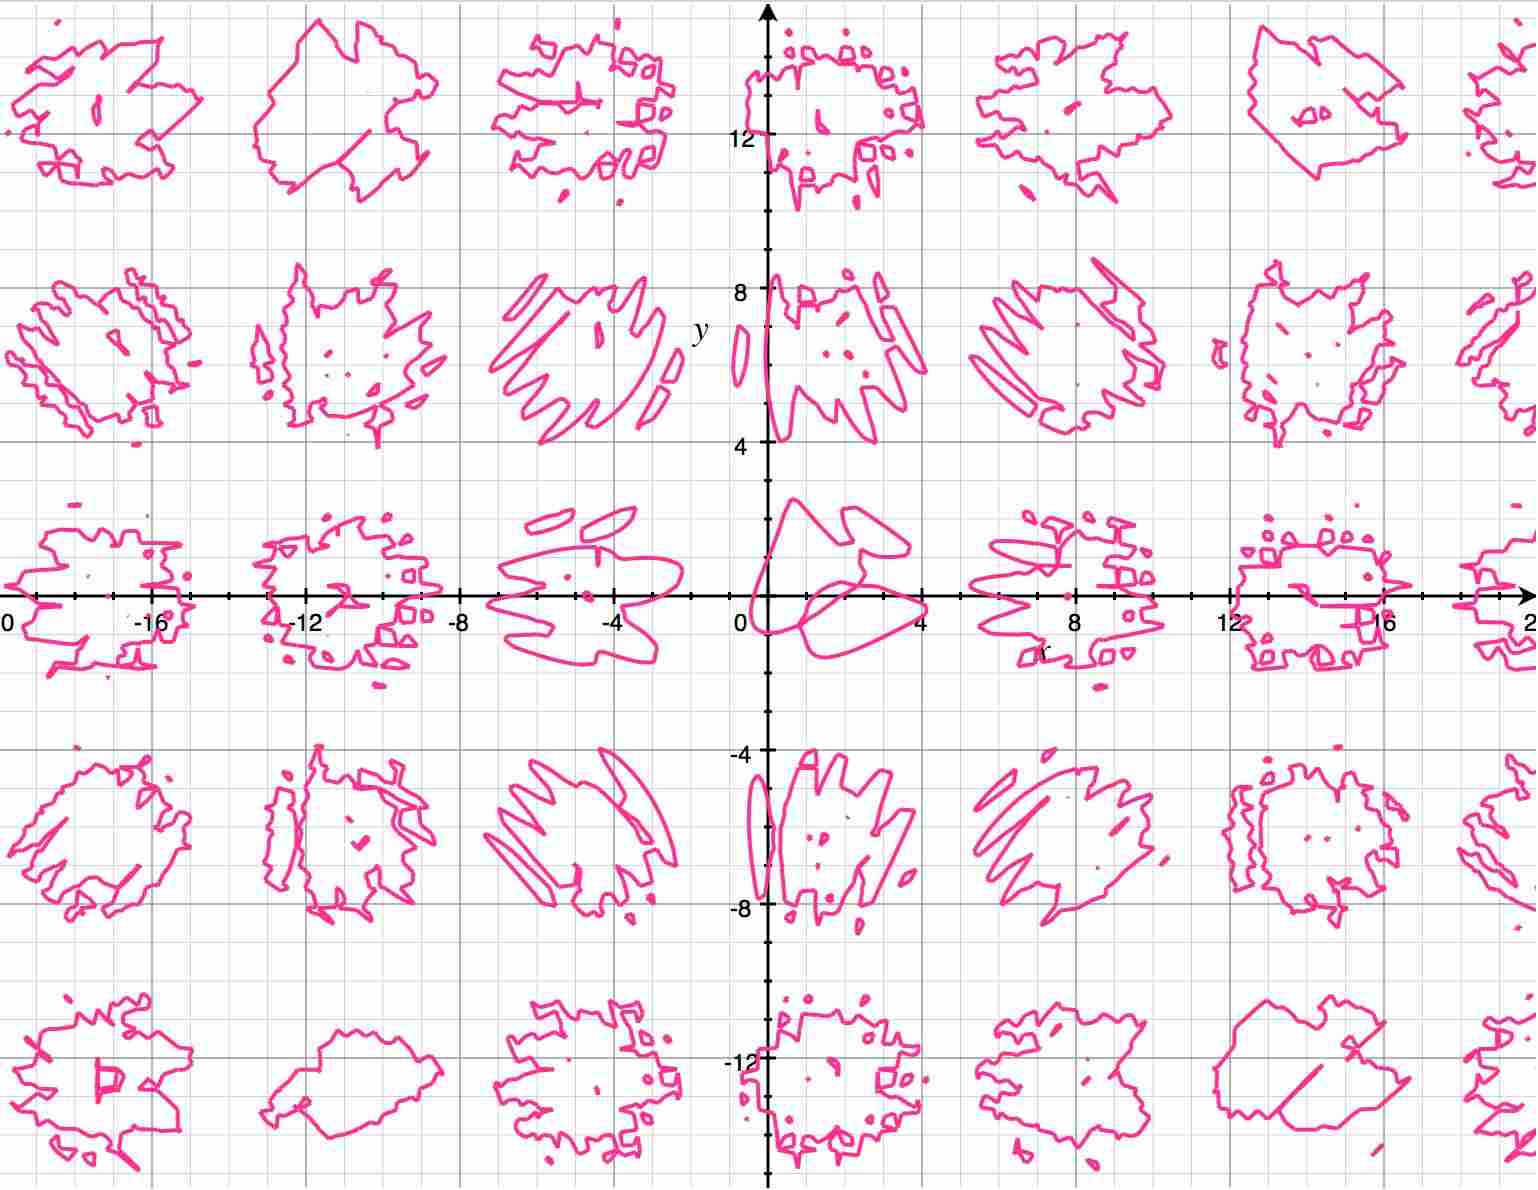
Splotches
sin(sin(x)+cos(y)) = cos(sin(xy)+cos(x))
Ripples
sin(xy) = cos(y)+sin(x)
Slinky
x = sin(t^2)
y = cos(t)
t = {0..10}
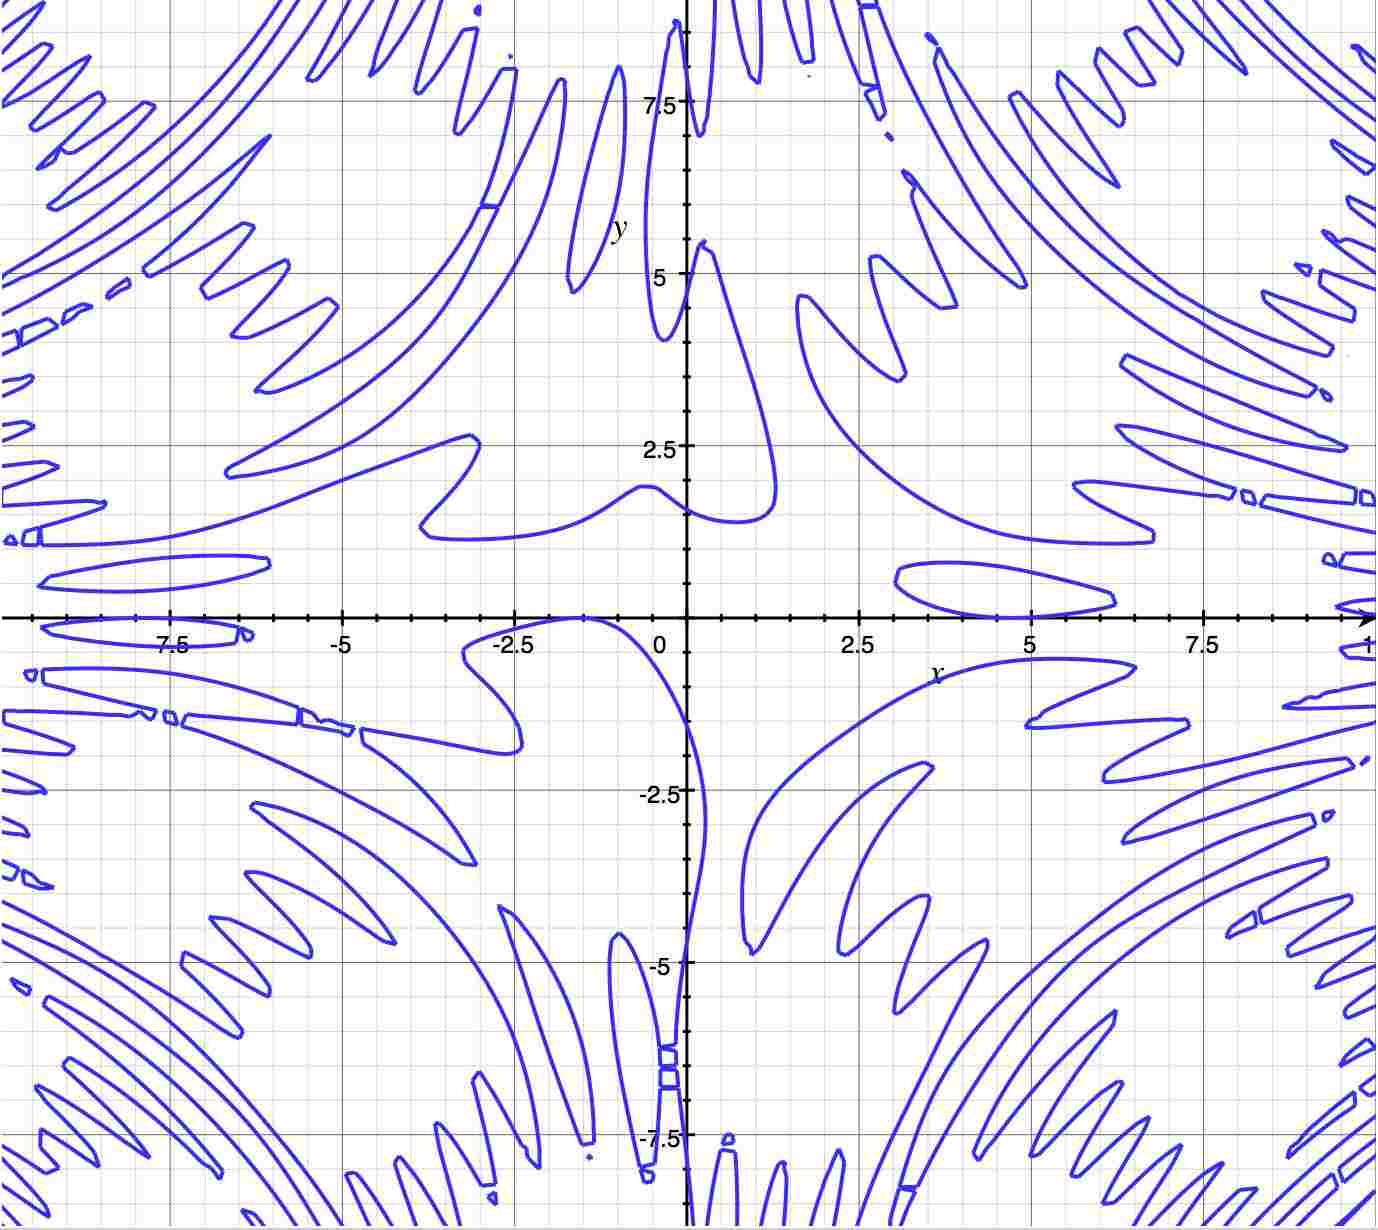
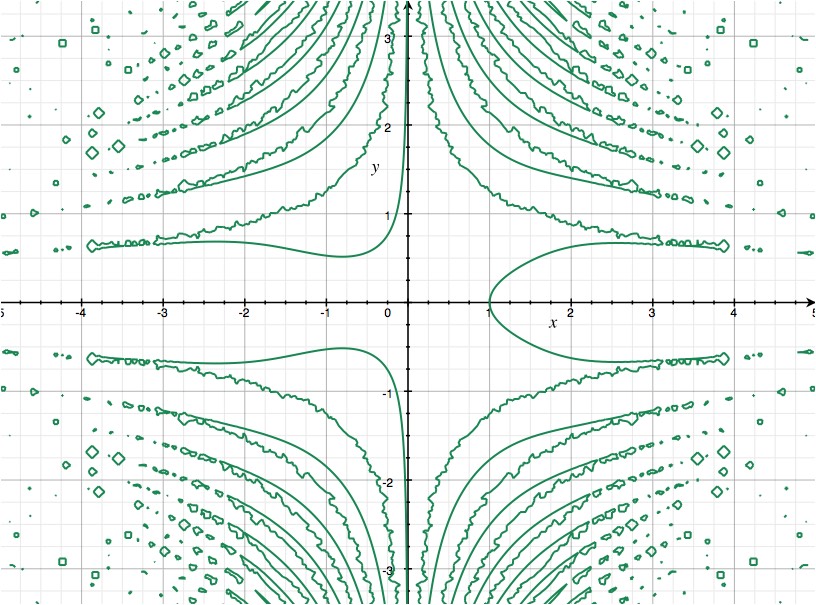
The Wiggles
cos(2x)-sin(xy)-tan(2y) = .5
Controlled Chaos
x^3 = 1+7tan(xy^2)
Fender Butterfly
r = sec(x)
y = tan(x)+cot(x)+K
k = {-5..5}
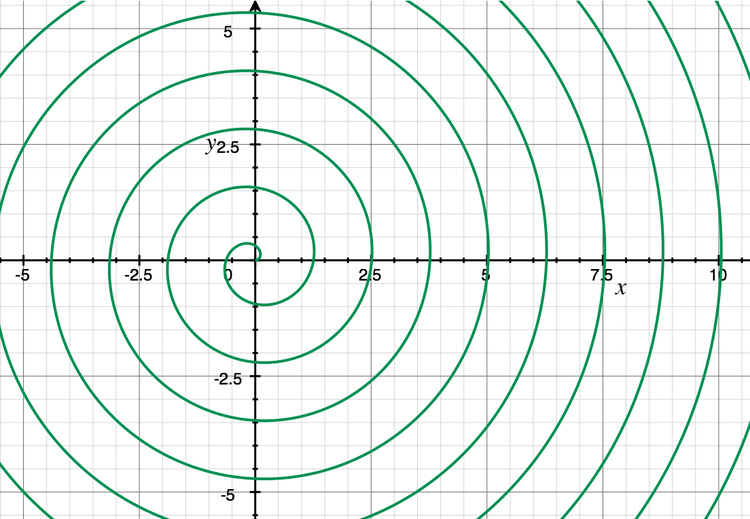
Spiral
x = (u/5)cos(u)
y = (u/5)sin(u)
u = {0..20}
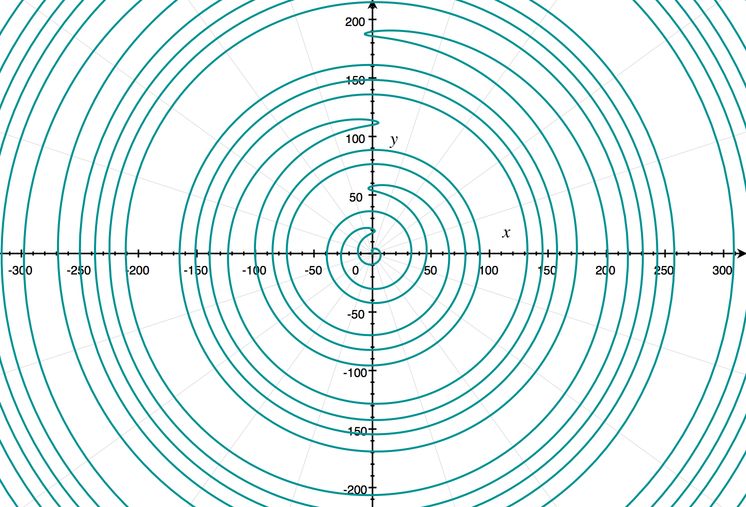
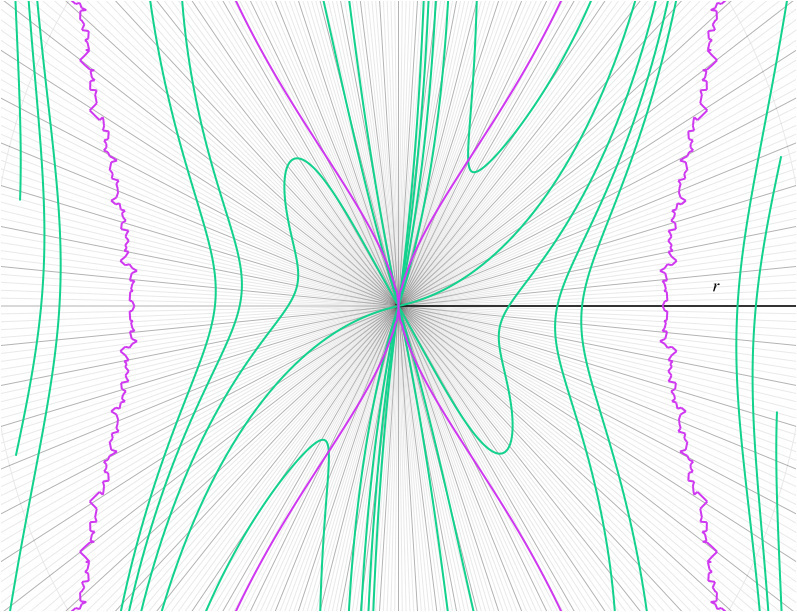
Double-Back
r = t^2-t
𝜃 = tsin(t)
t = {0..40}
Line Dancing
cos(x^2)+sin(xy)+tan(y^2) = 1
Convergence
y = kx/3
k = {1..18}
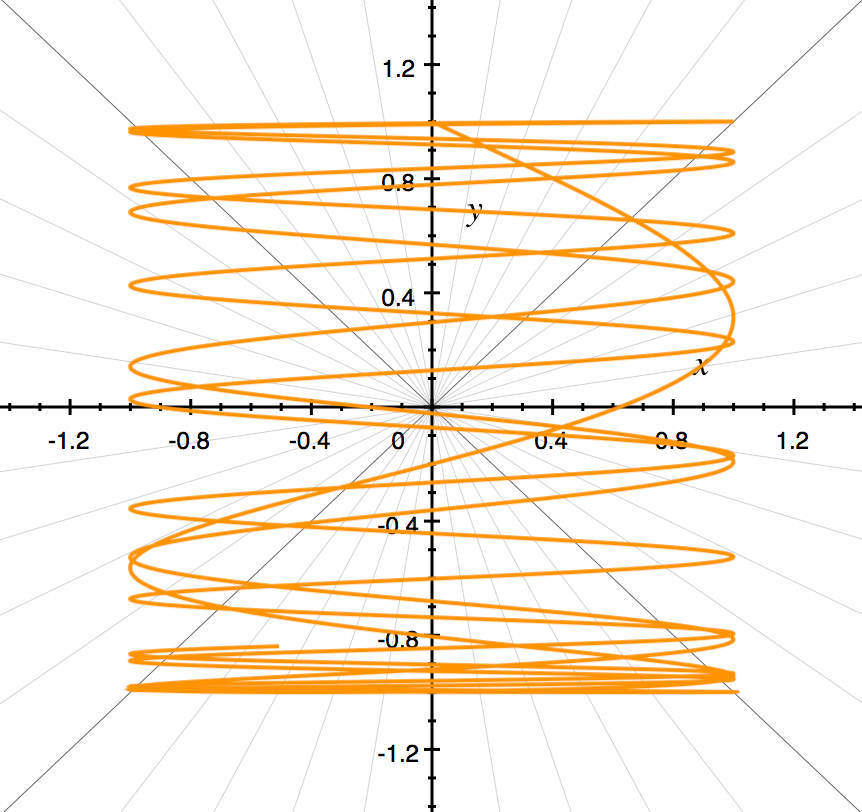
Basket Math
x = cos(11t)
y = sin(13t)
t = {0..2π}
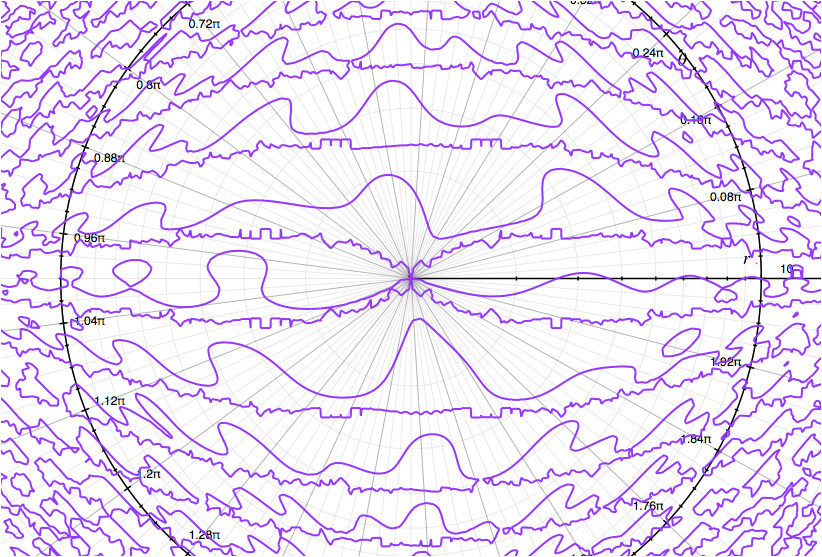
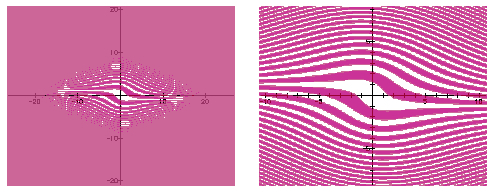
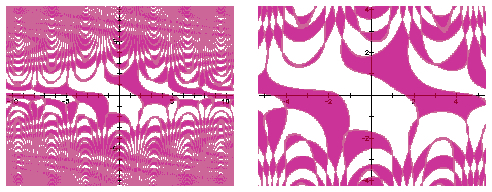
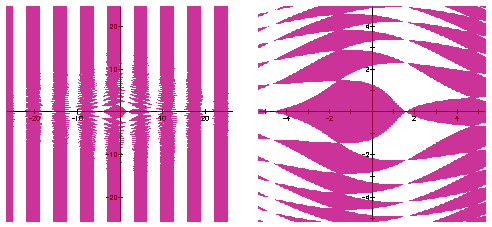
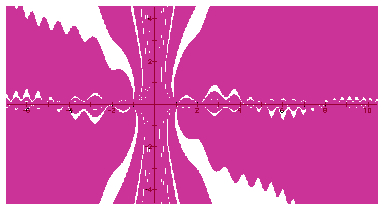
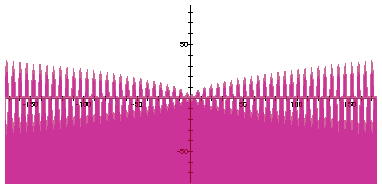
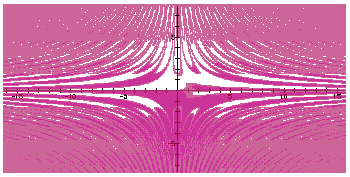
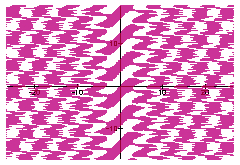
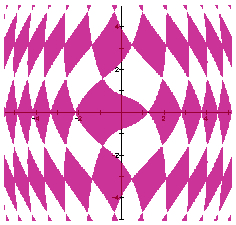
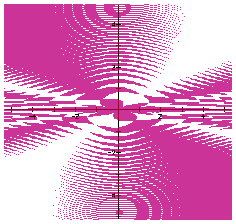
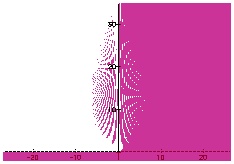
Designed in the late 1990's using the pioneering Mac app Graphing Calculator, later NuCalc:
rtan[sin(x)+cos(y)]^2 < xlog(y)
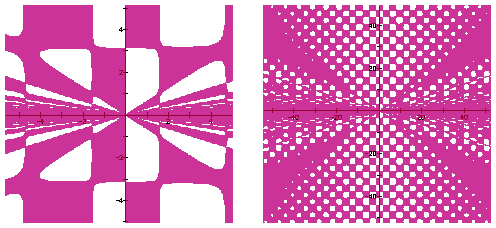
nsin(y)cos(x)/tan(x/y) < rcos[sin(x/y)]
sin(rx+y) > cos(ry+x)
sin{r[cosx(xy)]} > cos{rsin(y)]+x}
sin(x) < cos(r*ny)
tan(ry) < tan(rx)
tan(rx){cos[ry(sin(rx)]} < xcos(y)
sin(x/y) < cos[rn(y/x)]
tan[sin(x^2)-2cos(x)-y^2] < 1
tan{[sin(x^2)-2cos(x)-y^2]/(xy)} < 1
z = sin{[n(cos(x)+y)]/[tan(xy)]}
y < xtan[ycos(xy)]
rsin(y)cos(x) < rsin[xcos(y)]
sin(rx) < cos(ny)
sin(x/y) < cos(rny)
cos(y)+sin(y^x) < x/y
Mathematics and Art
Comprehensive article exploring the close relationship between math and art throughout the centuries.
Seven Times Mathematics Became Art and Blew Our Minds
Science Alert article highlights seven modern instances in which math and art imitate each other in beautiful ways.
Using Ancient Mathematics to Enrich Your Design Skills
Nowhere is the magical intersection of art and mathematics more clear than in areas comprising the broad field of design.
Making Mathematical Art
"Stunning symmetrical images created with just a few equations and a computer." From the venerable Scientific American.
Why the History of Maths is Also the History of Art
Article in The Guardian exploring how artists have utilized the inherent beauty of mathematical ideas in their work for thousands of years (at least).
Fifty Famous Curves
The title says it all. 50 fascinating general mathematical curves: Sinusoidal Spirals, Nephroids and Lissajous Curves, Fermat's Spiral, Epitrochoid/Epicycloid, more.
List of Curves
Wikipedia's accessible yet comprehensive index of articles discussing mathematical curves, their forms, and properties.
Wolfram Alpha Examples: Popular Curves
Yes, you can use mathematical relations to draw interesting, creative portraits of luminaries like Lady Gaga and Mew.
GeoGebra: Math in Art
A gallery of beautiful but simple GeoGebra math art projects. Sliders enable interactivity, learning by exploration. A playground for budding math artists.
Orbiform
None other than Leonhard Euler proved the constant width of this intriguing solid. Acts like a sphere, looks like a ... what? Artsy artillery shell? Details here.
Check out my Math-as-Art blog featuring additional original graphs like those above.
There's no better way to refute the notion of the lifeless sterility of mathematics than to visit the Wolfram Demonstrations Project. I urge you to take a moment to enjoy the intriguing mathematical objects and demonstrations you'll find there.
Unfortunately, many students have been mistaught that math is dry, rote, and one-dimensional, devoid of creativity and inventiveness, and lacking any connection to the arts.
Advances in computing technology have finally made possible the widespread discovery and appreciation of the sublime beauty of mathematics.
The art of math can now be enjoyed by all!
I hope you'll like the following graphs of mathematical relations I created involving nothing more sophisticated than high school precalculus.
Pretty Precalculus Graphs
Designed in 2018 using the Google Search graphing calculator:
Egg Carton
z = sin(x/2)+cos(y/2)
Wrinkled Paper
z = x-y+tan(x)-cos(8x-sin(2y))
Fancy Lapels
z = arcsec(sin(1/x)-cos(1/y))
Corrugated V-Roof
z = abs(sin(2x)-y)
Bed o' Nails
z = sin(4y)+cos(4x)
Arizona Desert
z = (x-y)/(sin(x)+1/cos(y))
Celery Row
z = (sin(x)cos(y))/(x-y)
Three Fingers
z = log(sin(1.1x)-y)
Plastic Chair
z = -abs(x)+2x^4-abs(x^2*y^3)
Lettuce Garden
z = 1/(sin(x)-cos(y))
Designed in 2018 using Wolfram Alpha:
Mesa Group with Hills and Valleys
z = sin(2x)cos(2y)exp(-(x^2+y^2)/6)
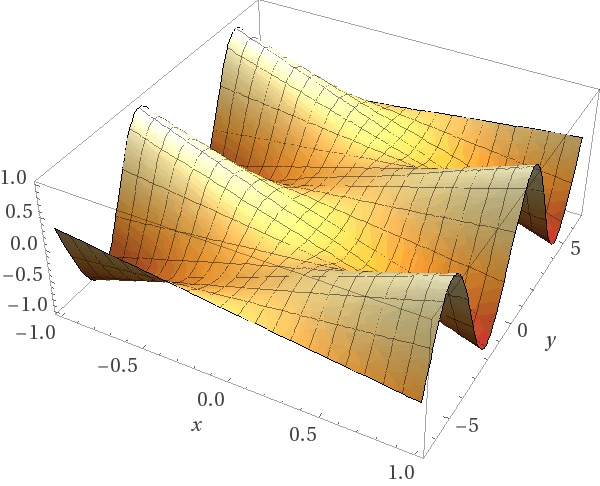
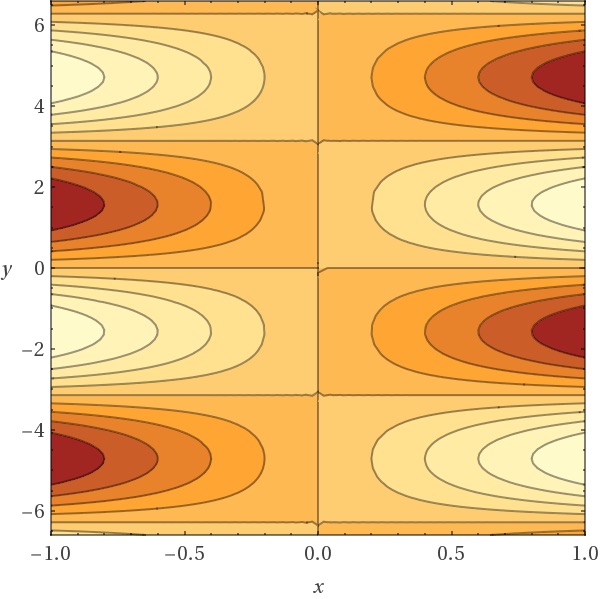
Slanting Waves
z = xsin(y)
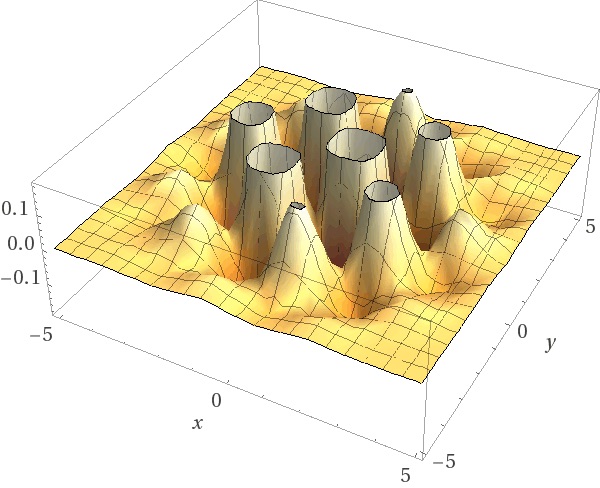
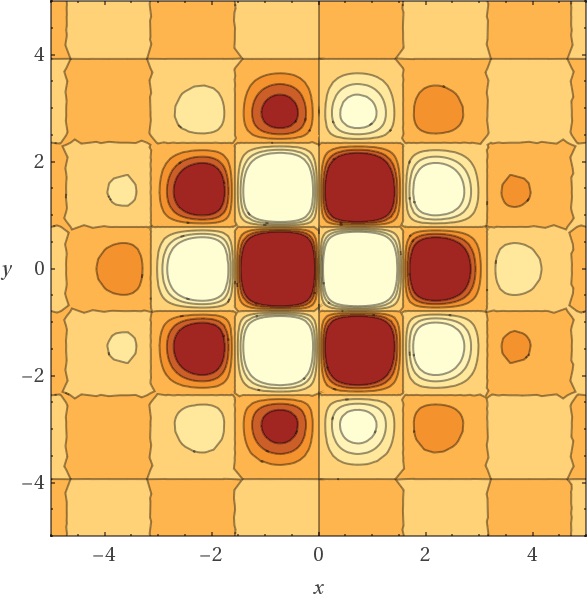
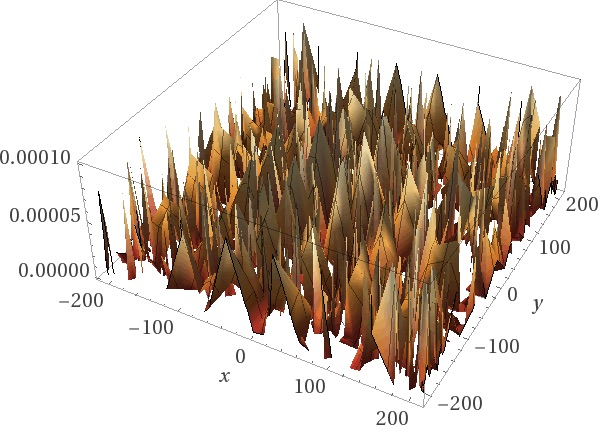
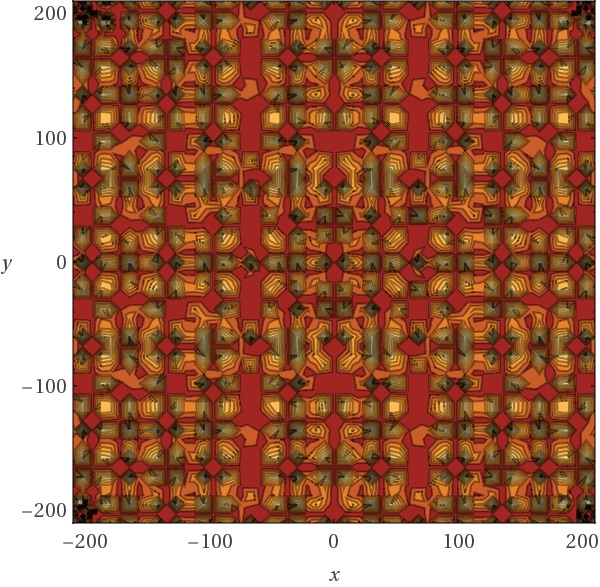
Tartan Forest
z = tan(.01sin(x)cos(y))^2
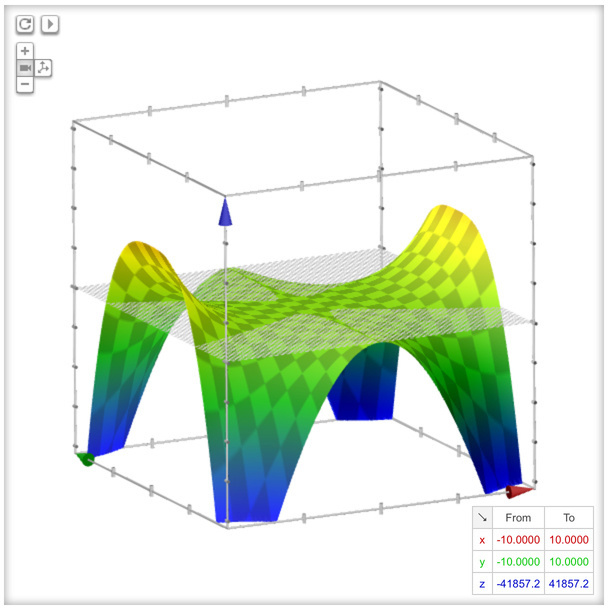
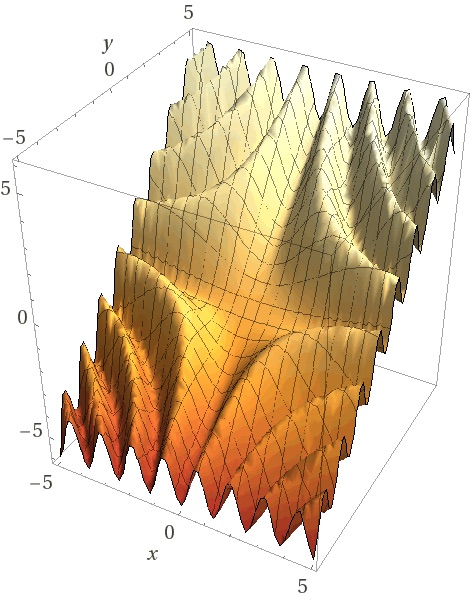
Techtonic Rift
z = x^3+tan(y)+cot(x)+y^3
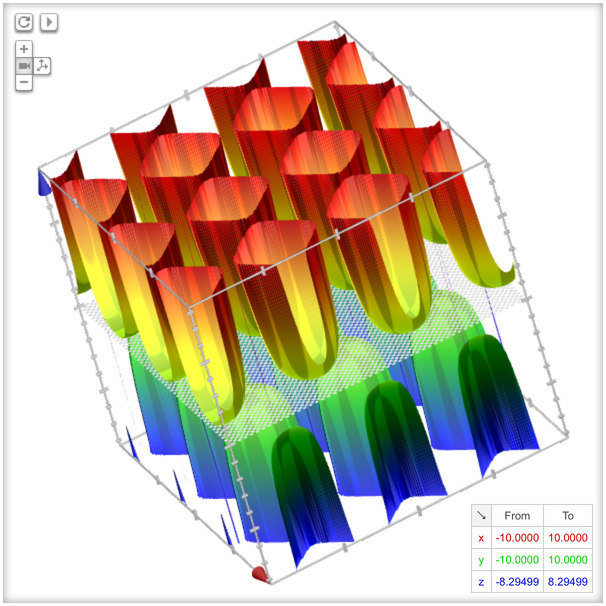
Spikes
z = tan(sin(x)cos(y))^2
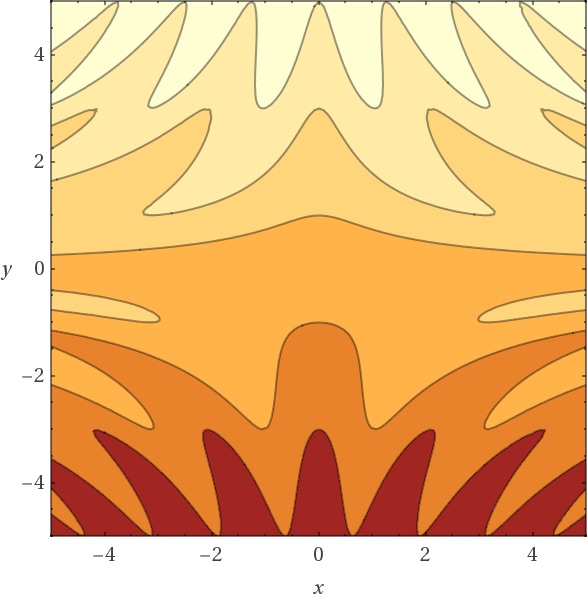
Gaping Maw
z = (x^2+1.5y^2)*e^(-x^2-y^2)
X Marks the Spot
z = (arccos(abs(x)+abs(y))/arcsin(abs(x)-abs(y))
Wavy Incline
z = -cos(xy)+y
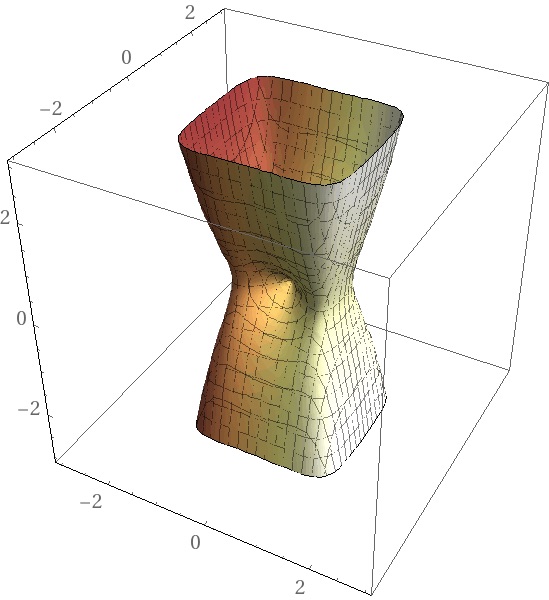
Dimpled Vase
z^2 = x^6-x^2+y^6+y^2
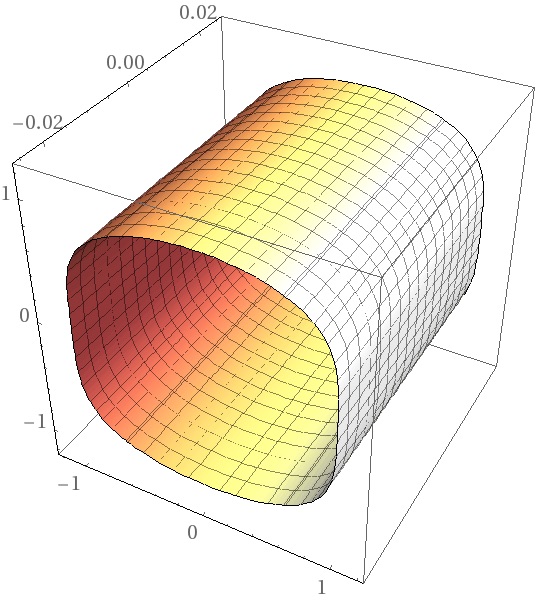
Squarish Tube
x^2-y^3+z^4 = 1
Designed in 2018 using Apple's Grapher app:
Splotches
sin(sin(x)+cos(y)) = cos(sin(xy)+cos(x))
Ripples
sin(xy) = cos(y)+sin(x)
Slinky
x = sin(t^2)
y = cos(t)
t = {0..10}
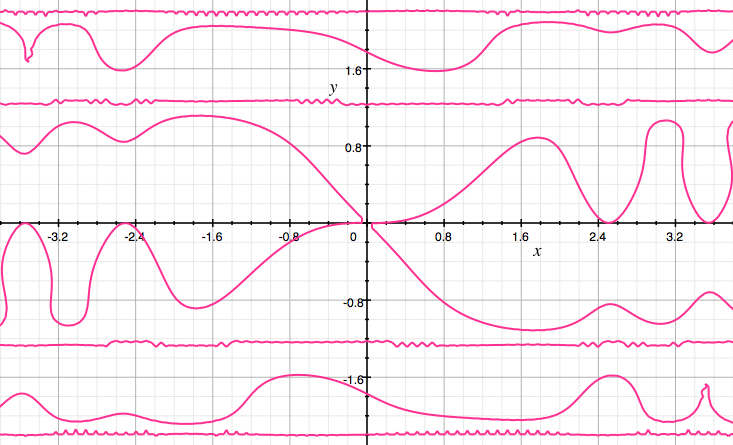
The Wiggles
cos(2x)-sin(xy)-tan(2y) = .5
Controlled Chaos
x^3 = 1+7tan(xy^2)
Fender Butterfly
r = sec(x)
y = tan(x)+cot(x)+K
k = {-5..5}
Spiral
x = (u/5)cos(u)
y = (u/5)sin(u)
u = {0..20}
Double-Back
r = t^2-t
𝜃 = tsin(t)
t = {0..40}
Line Dancing
cos(x^2)+sin(xy)+tan(y^2) = 1
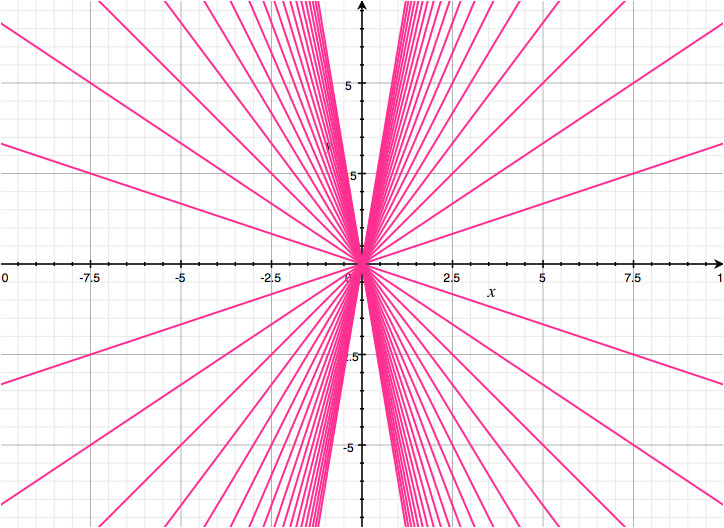
Convergence
y = kx/3
k = {1..18}
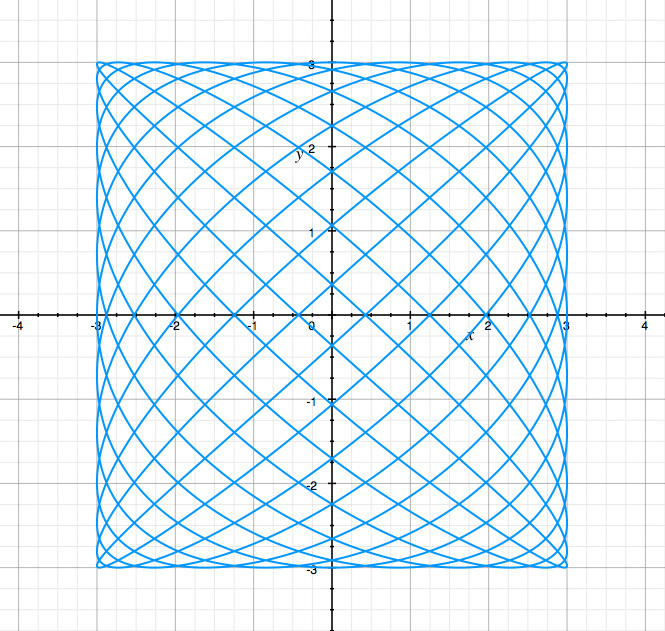
Basket Math
x = cos(11t)
y = sin(13t)
t = {0..2π}
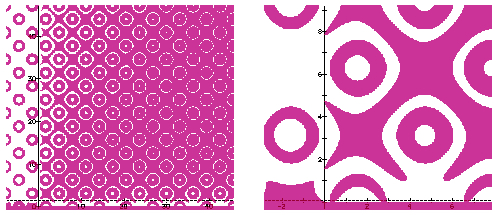
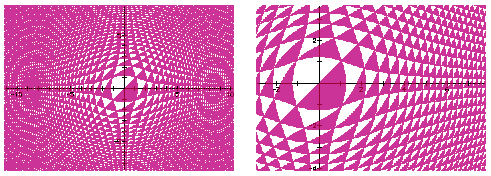
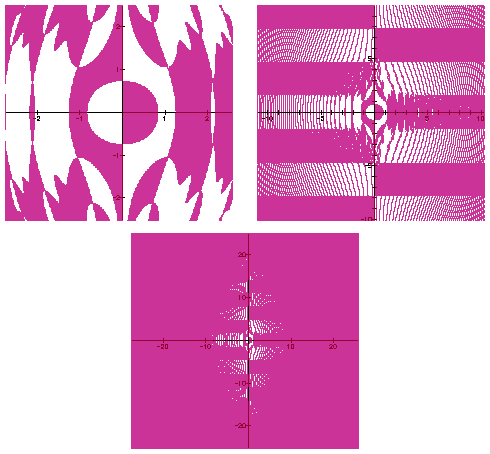
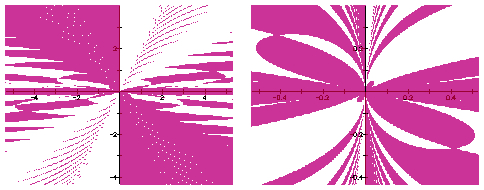
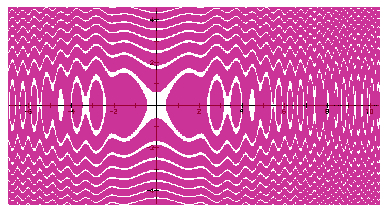
Designed in the late 1990's using the pioneering Mac app Graphing Calculator, later NuCalc:
rtan[sin(x)+cos(y)]^2 < xlog(y)
nsin(y)cos(x)/tan(x/y) < rcos[sin(x/y)]
sin(rx+y) > cos(ry+x)
sin{r[cosx(xy)]} > cos{rsin(y)]+x}
sin(x) < cos(r*ny)
tan(ry) < tan(rx)
tan(rx){cos[ry(sin(rx)]} < xcos(y)
sin(x/y) < cos[rn(y/x)]
tan[sin(x^2)-2cos(x)-y^2] < 1
tan{[sin(x^2)-2cos(x)-y^2]/(xy)} < 1
z = sin{[n(cos(x)+y)]/[tan(xy)]}
y < xtan[ycos(xy)]
rsin(y)cos(x) < rsin[xcos(y)]
sin(rx) < cos(ny)
sin(x/y) < cos(rny)
cos(y)+sin(y^x) < x/y
Articles
Mathematics and Art
Comprehensive article exploring the close relationship between math and art throughout the centuries.
Seven Times Mathematics Became Art and Blew Our Minds
Science Alert article highlights seven modern instances in which math and art imitate each other in beautiful ways.
Using Ancient Mathematics to Enrich Your Design Skills
Nowhere is the magical intersection of art and mathematics more clear than in areas comprising the broad field of design.
Making Mathematical Art
"Stunning symmetrical images created with just a few equations and a computer." From the venerable Scientific American.
Why the History of Maths is Also the History of Art
Article in The Guardian exploring how artists have utilized the inherent beauty of mathematical ideas in their work for thousands of years (at least).
Fifty Famous Curves
The title says it all. 50 fascinating general mathematical curves: Sinusoidal Spirals, Nephroids and Lissajous Curves, Fermat's Spiral, Epitrochoid/Epicycloid, more.
List of Curves
Wikipedia's accessible yet comprehensive index of articles discussing mathematical curves, their forms, and properties.
Wolfram Alpha Examples: Popular Curves
Yes, you can use mathematical relations to draw interesting, creative portraits of luminaries like Lady Gaga and Mew.
Other
GeoGebra: Math in Art
A gallery of beautiful but simple GeoGebra math art projects. Sliders enable interactivity, learning by exploration. A playground for budding math artists.
Orbiform
None other than Leonhard Euler proved the constant width of this intriguing solid. Acts like a sphere, looks like a ... what? Artsy artillery shell? Details here.
More!
Check out my Math-as-Art blog featuring additional original graphs like those above.
There's no better way to refute the notion of the lifeless sterility of mathematics than to visit the Wolfram Demonstrations Project. I urge you to take a moment to enjoy the intriguing mathematical objects and demonstrations you'll find there.
- > Home
- > About
- > Math as Art